

Start here
What Is a Real Estate Market Cycle?
Core concept
The Four Phases Explained
Go deeper
What Drives Phase Transitions?
Apply it
How Consumers Can Read the Signals
Take action
Using Cycle Knowledge in Housing Decisions
What Is a Real Estate Market Cycle?
A real estate market cycle is the recurring pattern of expansion and contraction that housing markets move through over time. Like other parts of the economy, housing does not move in a straight line - periods of rising prices and strong demand are followed by slowdowns, corrections, and eventual recovery.
Understanding this rhythm matters because it provides context. A rising market may look alarming to a first-time buyer worried about affordability, while a falling market may appear dangerous to a homeowner watching their equity. Recognizing where a market sits in its cycle helps consumers interpret conditions more clearly. For background on the metrics that describe market conditions, see what a housing market actually measures.
Market cycle
The recurring pattern of growth, peak, decline, and recovery that real estate markets move through over time.
Inventory
The number of homes available for sale in a given area at a specific point in time. Low inventory generally favors sellers; high inventory favors buyers.
Days on market
The number of days a home listing is active before it goes under contract. A rising average signals softening demand.
Hyper-supply
A cycle phase where new construction has added more housing than current demand can absorb, causing vacancy and inventory to rise.
Months of supply
A measure of how long the current inventory would last at the current sales pace if no new listings were added. Used to gauge market balance.
The Four Phases Explained
Most real estate economists describe four broad phases. They do not have sharp edges - transitions are gradual and markets can straddle phases - but the framework is useful for orientation.
Recovery
After a downturn, prices stabilize and vacancy rates begin to fall. Construction activity remains low because developers are cautious. Deals can be found, but confidence among buyers is slow to return. This phase often passes quietly before most consumers notice it.
Expansion
Demand accelerates. Employment growth, population movement, and improving confidence drive more buyers and renters into the market. Inventory tightens, prices climb, and new construction picks up. Sellers gain leverage. This is the phase that generates the most headlines.
Hyper-Supply
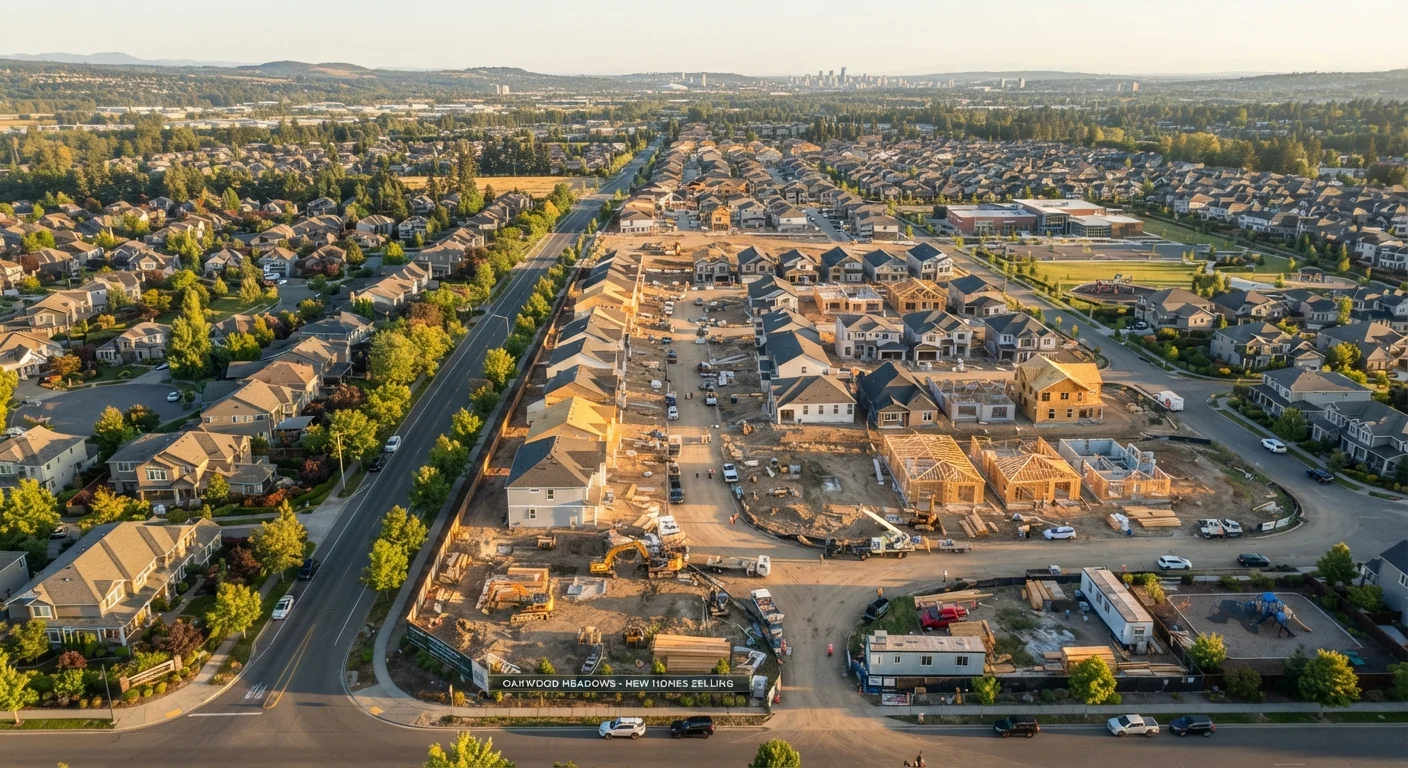
New construction catches up with - or overshoots - demand. Inventory rises, price growth slows or flattens, and properties sit on the market longer. The market is not yet in retreat, but the balance of power shifts toward buyers.
Recession
Vacancy climbs, prices soften, and building activity drops sharply. Sellers may need to reduce asking prices. This phase can be brief or extended depending on the severity of the demand shortfall and broader economic conditions.
For a deeper look at what each phase means for different types of housing decisions, see the four phases every consumer should know.
Cycles Are Local, Not Just National
National housing statistics describe aggregate trends, but your local market may be in a completely different phase. A metro with strong job growth and constrained land supply can remain in expansion while other regions enter recession. Always ground cycle analysis in local data - city or county level - rather than national headlines alone.
What Drives Phase Transitions?
Cycles shift because of changes in supply, demand, and the broader economic environment. The most common drivers include:
- Interest rates: When borrowing costs rise, buyer purchasing power falls, which can cool demand and slow price growth. Lower rates tend to stimulate activity.
- Employment and income: Job growth brings new residents and supports household formation - two key inputs for housing demand. Job losses quickly work in reverse.
- New construction: Builders respond to demand signals, but there is a lag. Permits filed today produce homes years later, which is why supply imbalances persist.
- Population and migration: Regions gaining residents face persistent demand pressure; those losing population see softer markets regardless of national trends.
- Policy and regulation: Zoning rules, tax policy, and lending standards all shape how fast supply can respond to demand and who can access the market.
Cycles Vary Widely by Location and Asset Type
Single-family homes, condos, and rental apartments do not always move in lockstep, even within the same city. Supply constraints, zoning, and local employer activity can cause distinct sub-markets to behave differently. Tracking data specific to the property type and neighborhood you care about gives you a more accurate picture than broad regional averages.
How Consumers Can Read the Signals
You do not need to be an economist to track where a local market sits. Several observable indicators tell a clear story when read together:
- Months of supply: A common rule of thumb is that roughly five to six months of inventory represents a balanced market. Below that tends to favor sellers; above it tends to favor buyers.
- Days on market: Homes selling quickly suggest strong demand. Rising days on market signals that buyers are gaining patience or options.
- List-to-sale price ratio: When homes sell above asking price, demand is intense. When they sell below, sellers have less leverage.
- New building permits: Rising permit activity signals that builders expect demand to continue. Falling permits suggest caution about the outlook.
For a plain-language breakdown of these and other data points, see housing market indicators every consumer should know and the metrics that actually predict where prices are heading.
Using Cycle Knowledge in Housing Decisions
Cycle awareness is a tool for context, not a crystal ball. No indicator tells you exactly when to buy or sell, and personal financial readiness matters far more than market timing for most households.
What cycle knowledge does offer is a calmer frame of reference. If you are a buyer entering an expansion phase, understanding that prices have likely risen for a reason - and that corrections do eventually occur - can help you avoid overextending. If you are a renter trying to decide whether to stay put, recognizing signs of a hyper-supply phase in your local market may be relevant to your negotiations.
For those exploring homeownership, home buying basics provides foundational guidance on the purchase process. Renters looking to understand how market conditions affect their options can start with Renting 101.
The most important principle: use market cycle awareness as one input among many. Local conditions, your financial situation, your timeline, and your goals all shape what a given market moment means for you specifically.
This article is for general informational and educational purposes only. It does not constitute financial, investment, or legal advice. Consult a qualified professional for guidance tailored to your circumstances.
US Census Bureau - New Residential Construction Data
The Census Bureau publishes monthly data on housing starts, permits, and completions by region. This is a primary source for tracking supply-side activity in the US housing market.
Federal Reserve Economic Data (FRED) - Housing Indicators
FRED aggregates dozens of housing market series including home prices, vacancy rates, and mortgage rates. Useful for tracking long-term cycle patterns and current conditions.
National Association of Realtors - Existing Home Sales Reports
Monthly reports covering median prices, inventory levels, and sales volume across US regions. A widely cited reference for gauging demand-side market conditions.
Frequently Asked Questions
Cycles vary considerably - historically they have ranged from roughly 7 to 18 years in the US, though no two are alike. Local economic conditions, policy changes, and external shocks can compress or extend each phase significantly.
Pinpointing a peak with certainty is not reliably possible, even for professional economists. Consumers can watch leading indicators - slowing price growth, rising inventory, longer days on market - that suggest a market may be approaching or passing a peak.
No. Local markets can be in very different phases at the same time. A city with strong job growth and limited housing supply may still be in expansion while a metro with job losses enters recession.
Not necessarily. A recessionary phase can mean lower prices and less competition, which may benefit prepared buyers. The right time to buy depends on personal financial readiness, not just market timing.
A cycle describes normal, recurring fluctuations in supply, demand, and prices. A bubble refers to prices rising far beyond what underlying fundamentals justify, often followed by a sharp correction. Not every market peak signals a bubble.
Sources such as the US Census Bureau, the National Association of Realtors, local multiple listing services (MLS), and the Federal Reserve's FRED database publish housing market data. Local real estate agents and housing economists can also provide context.
The content on this site is for informational purposes only and is not a substitute for professional advice. Always consult a qualified professional for guidance specific to your situation.